Weekly Commentary | Sept 5, 2022
Macro Picture
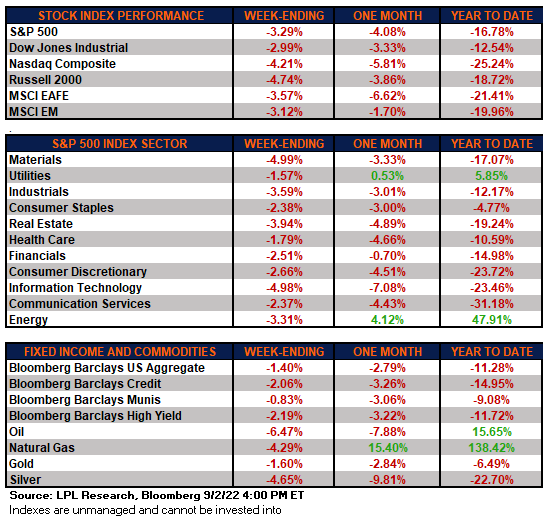
As the pivot fades, so have stocks in the last few weeks Stocks finished lower again last week as the markets imbed the implications of Jackson Hole and other messages from the Fed that had hawkish overtures. This is evident in interest rates being pushed higher with the 10-yr hitting 3.22%. Before easing on Friday morning, the 2-yr yield rose to its highest level since 2007, breaking above 3.5% amid hawkish Fed rhetoric and resilient US labor data.
Markets are still forecasting a 0.75% increase this month and a terminal rate near 4.0%. More importantly, the expectations of Fed rate cuts have been removed from the mid-2023 forecasts- mission accomplished by Powell.
The Fed’s quantitative tightening program will hit its stride in September, draining $95 billion from the economy each month, $60 billion in Treasuries and $35 trillion in mortgage-backed securities will be allowed to roll off the central bank’s balance sheet and back into private hands, putting upward pressure on interest rates and reducing liquidity in the US financial system. That’s up from the combined $47.5 billion that has been rolling off since June.
Friday's August jobs report showed the economy added another 315K jobs last month though the unemployment rate rose to 3.7% from 3.5%. Additionally, the JOLTs report, which shows the number of open job recs, unexpectedly rose in July reaching approximately two per unemployed worker.
The Bloomberg Global Aggregate Total Return Index, the benchmark for global investment-grade bonds, has fallen 20% from its 2021 peak on an unhedged basis, setting off the first bear market since the index’s inception in 1990.
Lastly, the Atlanta Fed GDPNow estimate for the third quarter shows that the US economy is growing around 2.6% annually.
CEF Market Review
Discounts continue to meander at about half of the retrenchment of the recent gains. I could see them heading back out to the tight channel that we were in for most of the first half of the year - before the recent rally to tighter discounts. In the last week, discounts barely moved for either taxables or munis.
Looking out longer term, you can see the oscillation in discounts and the general trends more clearly. The chart below shows discounts starting in 2019. You can see how rich things got in the latter half of 2019 into early 2020 before the floor falls out from Covid. But we quickly gained that back in the latter half 2020 and into most of 2021.
The market is basically unsure from here. If the economy successfully avoids recession and 'soft lands' then I can see discounts getting tighter like they were in 2021.
One of the things to note about discounts today is how close they are to 2019 highs. At that point we were telling members that the CEF market is rich and that reducing exposure makes sense. This is why, starting a couple of weeks ago, we recommended the same. We've backed off a bit since then but not by much.


