
Weekly Commentary | Aug 7, 2022
This is our FULL Weekly Commentary, that goes out to subscribers on Sunday. We are giving the public rare, full access.

This is our FULL Weekly Commentary, that goes out to subscribers on Sunday. We are giving the public rare, full access.

Macro Picture
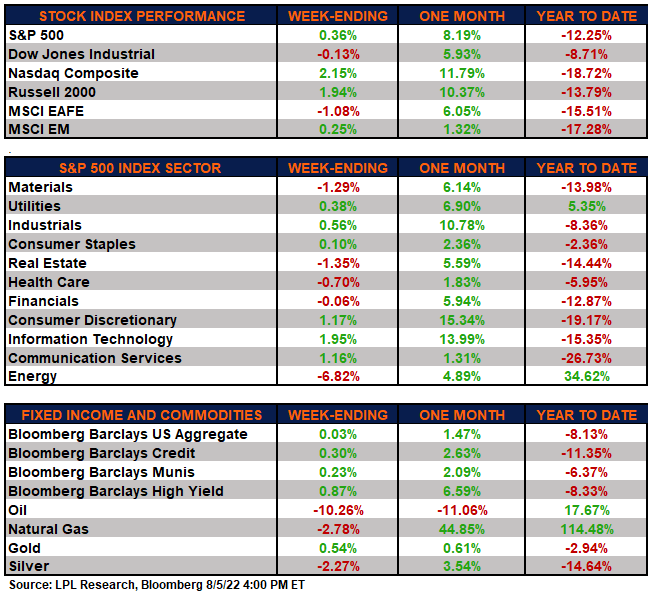
Equity markets were mixed this past week as liquidity continues to dry up. The strong labor market was the big news on the week easing fears of a recession.
Interest rates rose nearly 20 bps to 2.85% mostly after the jobs report on Friday showed more than 500K new jobs being created. That was nearly double the consensus estimate. Total employment has now returned to the pre-pandemic level. The unemployment rate is back down to 3.5%, where it was just before the pandemic started.
The Fed now has more room to raise rates and will likely face a greater test to their soft landing scenario. That is because in order to reduce inflation in an economy adding 500K new jobs a month, they will literally have to break its back through a much higher terminal rate than is expected.
The Bank of England increased rates by the largest amount in 27 years moving up 0.5% to 1.75%. More importantly, the bank noted that they are forecasting a recession starting in the fourth quarter and will last five quarters - just as long as the Financial Crisis. The bank also sees their inflation rate could hit +13.3% yoy in October and does not forecast them falling back to its 2% target rate until at least 2025.
Some sanguine and very direct talk from the English central bank.
The yield curve remains heavily inverted on 10s-2s and nearly inverted on 10s -3m. That latter, if it gets to negative, will seal the deal on whether the US economy heads towards a recession later this year.

As we detail below, we haven't even seen the higher rates and tighter liquidity reverberate through the economy yet. So far this year it has been about risk assets adjusting and anticipating higher rates but with only a guestimate of what that will do to the broader economy.
CEF Market Review
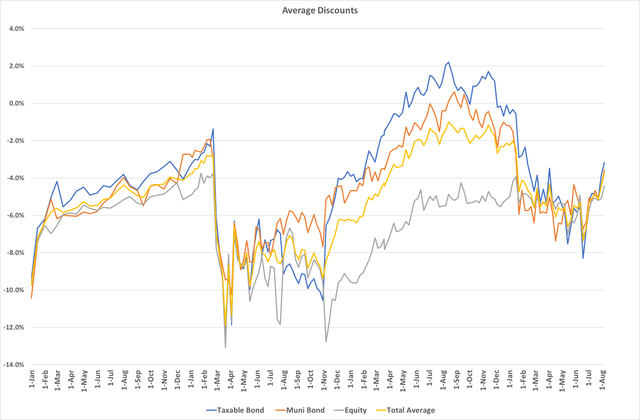
Discounts continue to rally hard and have broken out of the range they've existed in for the last several months. In fact, discounts on equity funds are now in their 16th percentile meaning that only 16% of the time going back to 1996 have they average a tighter discount/higher valuation.
Taxables have cross the 50th percentile to 45% so they are near their long-term median average. The average taxable bond fund discount is now just -2.9%. It's hard to believe that 50% of the time taxable bond CEFs have averaged less than -3% discounts but remember that these do not have normal distributions - they are heavily left-tailed skewed.

Muni CEFs are right at 50% with an average discount of -3.5%. That is still about -2.5% wider than they were at the start of the year.
Our counter-cyclical approach would suggest taking some profits here as valuations are not fully incorporating the risks that are out there.
While we certainly could avoid recession and be entering a new bull phase, we need to play the percentages and practice good risk management. That means starting to harvest profits on positions to control risk.
NAVs have performed well these last few weeks thanks to tightening spreads but remember, there's only so much tightening that can be experienced. There is a natural end to that tailwind when we get sub-4%. Right now, spreads stand at 4.5% down from touching 6.0% on July 5th.
That is an amazing amount of tightening in a short period of time as the market is believing that a Fed pivot and soft landing are now the baseline scenario.
In terms of sectors, NAVs were predominantly higher outside of MLPs, real estate, utilities, and energy/ resources.

Emerging Market equity is the cheapest sector by z-score. It has been a terrible area of the markets for a few years now. Jeffrey Gundlach of DoubleLine Funds recently noted that if there was an area of the market that he would buy if he were going to sleep for two years, it would be EM equity.
I prefer to use ETFs for this exposure (and the occasional mutual fund) over the CEFs available. They just haven't been well managed on a NAV basis.

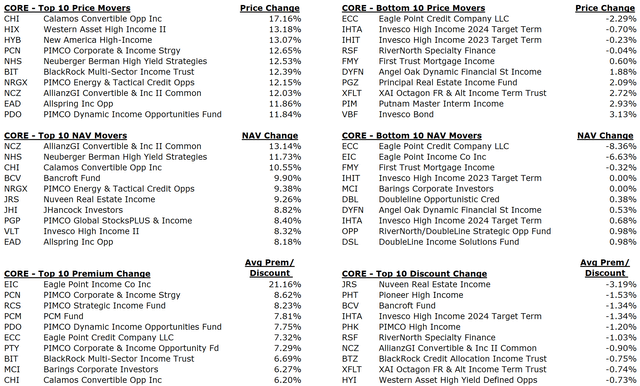
Calamos Convertible Opp (CHI) is finally correcting losing about 6% of its hefty premium. The fund was one of our most overvalued when we highlighted funds to sell a couple of weeks ago. It remains so at +10% premium.
Blackrock Credit Allocation (BTZ) is one of my long-term, buy-and-hold, favorite CEFs in the credit space. It saw its valuation reduced by nearly 3% last week alone back to a -7.1% discount. This is one I like to buy around a -9% discount and trim around -4%. This is something I've done for years and it has worked out well. The NAV has been moving nicely higher and I like the valuation here despite the fact that it isn't at a -9% currently. If you don't own a position and would like to, place some limit orders below the current price of $11.50 and see if you get hit.
I noted last week I was watching XIA Octagon FR & Alt Income (XFLT) fund. It lost another 1.8% of its premium and is down to +4.2%. I would be a small buyer around par even though the fund holds riskier investments that could get hit in a more moderate recessionary environment. But remember, I don't like the make binary decisions so I always keep some allocation to taxables in case I'm wrong.
I received a couple of questions on Eagle Point Income (EIC) and the +27% premium that shows on CEFConnect. The NAV, as of 6/30, was $13.66. They only report NAV monthly and we should get the July NAV soon. Given the market rally, I would expect the NAV to be in the mid-$14s. That would mean, given the $16.93 price, that the premium is really in the mid-teens. While that is still high, it is NOT +27%. And there's a chance that the NAV could be in the high $14s given the rally in junk and equities which would mean that premium could be as low as 12%. Still, I would rather be a seller than buyer.
Lastly, Western Asset Mortgage Opp (DMO) has rallied nicely in the last two weeks. We have been pushing that one and still think it's a good buy here even though we are likely to see further distribution cuts in the future. However, the cuts are typically down every 3-6 months (they report distributions quarterly) and the cuts smallish. The cuts make no material change to the valuation since they do not earn the distribution anyway. It is all optics.
Some other funds we would take action on here include trimming/selling:
Brookfield Real Assets Income (RA)
Advent Convertible & Inc (AVK)
Calamos Dynamic Conv & Inc (CCD)
Aberdeen Income Credit Strat (ACP)
PCM Fund (PCM)
Eaton Vance Ltd Duration Inc (EVV)
Guggenheim Strategic Opp (GOF) ---> Switch to GUG
Eaton Vance Short Duration (EVG)
Blackrock Multisector Inc (BIT)
Western Asset High Inc II (HIX)
Blackrock Floating Rate (FRA) ---> swap to XFLT or BGB
JHancock Preferred Income (HPI) ---> Swap to PTA
Allspring Multisec Inc (ERC) ---> Swap to DCF
Commentary
We've had quite the rally since mid-June with risk assets rising broadly across the board. What is interesting is that it isn't just the beaten-down names that have rallied hard- it is a very wide array with no real focal point to the rally (like tech stock, junkier credits, or non-profitable tech).
The reason for the rally has simply been that the notion that a recession is imminent has declined. Inflation pressures, so the market believes, will be coming down precipitously and thus, the Fed will be able to pivot sharply at the end of the year.
The market is making this belief based on the very strong jobs market and that the Fed will be able to engineer a soft land because inflation will come down naturally (commodities are down sharply so inflation will come down, right?).
The yield curves don't lie and the fact that they are so inverted, to me, just means a higher probability of a recession. This recession may look a little different than one's past. There will likely be no V-shaped recovery. Instead, it would likely take the form of a bumpy road that trends lower.
The ECRI Weekly Leading Index fell again last week.

Here is an excerpt from the ECRI article:
With real GDP falling again in Q2 2022 after declining in Q1 2022, many will likely conclude that we’re in recession. In fact, the data show that, over the past 75 years, there’s been a U.S. recession every time real GDP has fallen for two consecutive quarters (in Q2 1947 and Q3 1947, real GDP did decline without a recession). More here
So the $64,000 question is, is this the start of a new bull market? I don't think so. There's overwhelming economic evidence that the economy will continue to slow and that this 'slowdown' we've already seen is just the very beginning. It's not even the second inning.
The effects of quantitative tightening and an inverted yield curve have yet to be felt widely in the economy. It will take at least another several months, if not until early 2023 to see the real slowdown, especially within the consumer consumption area. To wit, there are already signs of the consumer pulling back drastically thanks to inflationary pressures and higher debt servicing costs.
The jobs data, to me, is a sign that the Fed is losing more control. A wage-price spiral is happening in real time. Employees have significant bargaining power right now to demand higher wages. And new recruits are asking for more and more and employers are giving in because they need the workers.
A wage-price spiral happens when employees switch jobs or ask for raises to get higher wages. This can only happen in an economy at full employment, which we are at. The higher wages, in turn, drive up costs and result in further inflation causing workers to want to seek higher wages. Its a vicious cycle that is hard to break unless you cause a recession and move away from full unemployment.
The jobs market has now recovered all the jobs lost from the pandemic. And the +0.5% m/m wage increase, I think, kills the chance of a Fed pivot any time soon.
We get the CPI and PPI reports next week which will be biggies. Core inflation is expected to be +6.1% vs last month's +5.9%. Headline inflation is expected to come down four-tenths to +8.7%. If we see another blow-off-the-top number with headline above +9.1%, and Core above that +6.1%, you could see a market-sell off. The Fed would definitely go 75 bps in Sept - at least- and would likely have to do the same in December.

Today's market is all macro driven- like in 2020 and 2021 it was all Covid driven. Inflation and rates will be the key determinant. I will continue to watch the weekly jobless claims for signs that the last shoe is dropping - the labor market. That will be a very important tell.
CEF News and Corp Actions
Distribution Increase
Pioneer Muni High Income (MHI): DIstribution increased by 20% to $0.048
Pioneer Muni High Income Adv (MAV): Distribution increased by 10% to $0.044
Pioneer Muni High Income Opp (MIO): Distribution increased by 5.0% to $0.063
Western Div Inc (WDI): Distribution increased by 4.7 to $0.125
ClearBridge Nrg Midstream Opp (EMO): Distribution increased by 2.0% to $0.51
Eaton Vance Floating Rate 2022 (EFL): Distribution increased by 3.5% to $0.03
Eaton Vance Sr Income (EVF): Distribution increased by 2.7% to $0.038
Eaton Vance Sr Duration Div Inc (EVG): Distribution increased by 1% to $0.0921
Distribution Decrease
Herzfeld Caribbean Basin (CUBA): Distribution decreased by 34.4% to $0.173625
BNY Mellon Muni Inc (DMF): Distribution decreased by 17.2% to $0.024
Invesco PA Value Muni Inc (VPV): Distribution decreased by 8.6% to $0.0425
Delaware Div & Inc (DDF): Distribution decreased by 4.6% to $0.0582
Delaware Enh Global Div & Inc (DEX): Distribution decreased by 4.5% to $0.0526
Delaware Icy High Income Opp (IVH): Distribution decreased by 4.1% to $0.07
Distribution Policy Change
Herzfeld Caribbean Basin (CUBA): The fund is altering its distribution policy whereby the fund will be paying distributions using a combination of shares of common stock and cash.
The distribution for stockholders will be paid in cash or shares of our common stock at the election of stockholders.
The total amount of cash distributed to all stockholders will be limited to 20% of the total distribution to be paid, excluding any cash paid for fractional shares. The remainder of the distribution (approximately 80%) will be paid in the form of shares of our common stock. The exact distribution of cash and stock to any given stockholder will be dependent upon his/her election as well as elections of other stockholders, subject to the pro-rata limitation.
The number of shares of common stock to be issued to stockholders receiving all or a portion of the dividend in shares of common stock will be based on the volume weighted average price per share of common stock on the Nasdaq Capital Market on September 13, 14 and 15, 2022.
Management believes that the cash and stock distribution will allow the Fund to strengthen its balance sheet and to be in a position to capitalize on potential future investment opportunities.
Merger
Angel Oak Dynamic Financial Strategies (DYFN), Angel Oak Financial Strategies Inc (FINS): The merger between these two like funds was completed last week. DYFN is no longer trading and the shares have been converted into FINS shares at a ratio of 1.17 common shares of FINS for each share of DYFN. This increases FINS total assets to $589mm, up $109mm from the absorption of DYFN assets.
Rights Offering
Virtus Total Return (VTR): The fund announced that the registration went effective on their transferable rights offering.
The Fund may increase the number of shares of common stock subject to subscription by up to 25% of the shares, or up to an additional 4,125,000 shares of common stock, for an aggregate total of 20,625,000 shares. Shareholders of record will receive one right for each outstanding share owned on the record date, August 9, 2022. If a record date shareholder's total ownership is fewer than three shares, such shareholder will receive three rights so that the shareholder may subscribe for one share.
Statistics
Sector:


Core:

All CEFs:


Yield Hunting Premium Subscription
We always give a 7-day free trial to show what our service offers- don’t hesitate! Give us a try! And don’t forget our 10% of SALE!
Our strategy, simply put, is to create a portfolio of fixed income closed-end funds and alternative asset classes (such as REITs, Preferred Stock, and Baby Bonds) to create a risk managed approach to retirement income.
This approach can either be a standalone strategy (i.e- for most or all of your portfolio) or as a replacement for the failed 'fixed income' portion of your equity/ bond mix.
Either way, the goal is to create a safe income stream that meets as much of your monthly retirement expense needs as possible- thereby leaving the principle (as well as any equity positions) alone to grow unmolested. If selling is not necessary, we have effectively removed any or all sequence of returns risk from the portfolio.
We urge you to not miss this opportunity to take advantage of this really great offer. You really have nothing to lose with the one week free trial which locks you in at the lower rate.
This is a unique opportunity to create a fixed income closed end fund portfolio utilizing extremely rare discounts and high yielding securities. Yield Hunting can be utilized in various ways- to be the 'bond side' of your 60/40 diversified portfolio, your paycheck replacement strategy for retirement, or as a way to de-risk away from lofty equities and risky dividend stocks.
Our service utilizes Closed-End Funds, ETFs, Muni's, REITs, and Preferred Stocks to decrease risk, while still achieving a 8+% yielding, income-producing portfolio.
With a subscription to Yield Hunting, you get access to:
Our Three Portfolios that help create a safer and consistent 8% income stream:
Core Income Portfolio This is our main model. It has about a dozen securities (almost all CEFs) with almost no equity exposure. The risk profile by NAV is less than half that of the S&P 500. It is a bit more passive than most portfolios, with only a couple of trades per month- making it very easy to follow even for the novice investor. Current yield 8.3%.
Flexible Income Portfolio: This is our active trading portfolio. It is designed for more aggressive investors looking to maximize capital gains along with yield- looking for funds that have a high probability of mean reversion (extremely large discounts that have a good chance of closing in the short term). Current yield of 7.4% (some tax-free muni income).
Taxable Income Portfolio: This portfolio takes a more tax-advantaged approach, attempting to maximize after tax gains by utilizing funds that keep an eye on tax liability. Current yield of 4.9% (mostly tax-free).
Peripheral Portfolio Database: This is aimed at diversifying the Core Portfolio by investing in equity CEFs and REITs, preferred stocks, exchange-traded baby bonds, ETFs, Mutual Funds, and other securities. It is less a full portfolio than a list of researched funds that we recommend for those that want to expand beyond the conviction list of securities but don't have the time or inclination to do the research themselves. This includes a "Safe Bucket" section detailing the highest yielding cash-plus securities where excess cash can earn upwards of 4%. The model portfolios are designed with real time pricing detailing specific "buy, hold, sell" ratings.
Low Maintenance Models: This is for the pure, hands-off novice. In these models, you will assess your risk tolerance and can simply follow the model as you see fit within your risk profile.
Our premium service is organized in the following manner:
Morning Note - An almost daily note on the current situation in the market and what you need to know as the trading day starts.
Monthly Newsletter - Details the current investing environment, portfolio construction techniques and advice, and a review of our model portfolios. It is the perfect place to start for new subscribers!
Weekly Commentary - Goes through the events of the week and things to watch for in the upcoming week. This also includes performance of our holdings and the effects the current market situation will have on them.
Yield Hunting Review - this will take a more macro approach to the market for more long-term
Spotlight - Several write-ups each month, with specific analysis on securities we want to bring to our members attention where we see specific opportunities.
Alerts - Buy/ sell alerts on securities within the portfolio as conditions warrant
And finally....
Access - You are not on your own! We are available weekdays during market hours via email for any and all questions or concerns. We also offer a complimentary cursory review of your portfolio, so you know you are not going it alone and always have a professional's ear whenever you need it.
Why Yield Hunting?
While our service is aimed primarily at late stage career and retired investors, the strategy can also be used to lower risk by augmenting traditional equity investing via open-end mutual funds or ETFs. This includes those who have spent many hours researching and selecting the equity side of their portfolio, but don't have the knowledge or time to do the same for the fixed income side. We use high quality institutional research to avoid distribution cuts, opportunity risk, and other pitfalls which can derail your strategy.
Our Team
Three For The Price Of One! Being one of the larger services means we have a larger budget. We believe we've assembled some of the best talent on Substack and Seeking Alpha analyzing closed-end funds.
Our stacked team includes:
1) Alpha Gen Capital (Yield Hunting) - I am a career financial advisor (non-practicing) and investor. Not someone from another career doing this on the side. The AGC team and I use detailed analysis to provide safe and actionable insight without the fluff or risky ideas of most other letters. Our goal is to provide a relatively safer income stream with CEFs and mutual funds. Maybe more importantly, we also help investors learn about investing and how to properly construct a portfolio.
2) George Spritzer - Another career financial guru who runs a registered investment advisor with a specialization in closed-end funds for individuals. George uses the following investment strategies: 1) Opportunistic Closed-end fund investing: Buy CEFs at larger than normal discounts to NAV and sell them when the discounts narrow. 2) Exploit special situations: tender offers, fund terminations, fund activism, rights offerings etc.
3) Landlord Investor- Spent his career as a management consultant for public sector clients at a multinational consulting firm in the DC area. He has transitioned to a new career as a full time landlord. His investment portfolio is comprised of two parts -- broad-based index funds and income plays such as preferred stock, CEFs, and REITs. He also owns individual/baby bonds which he buys on margin to boost total return. Landlord is our 'individual preferred stock' expert analyst.