Moving Beyond The 60/40 Portfolio | Part I
We are between a rock and a hard place. For investors who are between the ages of 50 and 75, investing today is probably the hardest environment in history. That is because interest rates are near all-time lows and stocks are at all-time highs with fairly high valuations.
In this conceptual portfolio building report, we will go through why investors should consider changing their thinking and the underlying building blocks to their portfolios. Recency biases and anchoring are the most fundamental and most difficult aspects of investing to overcome.
In Part I, we will go through some concepts on how to think about building your portfolio for the new paradigm.
Future Returns Will Suck! But Probably Not As Bad As They Say
The return of your portfolio is largely a function of the valuation at the starting point of your measurement period. If we were standing in March 2009 and assessing future returns from there, it would look a lot different than future returns today.
There is a tight correlation between valuation levels implied by a host of valuation measures and future returns. And the longer out those future returns are assessed, the more correlated the returns to valuation becomes.
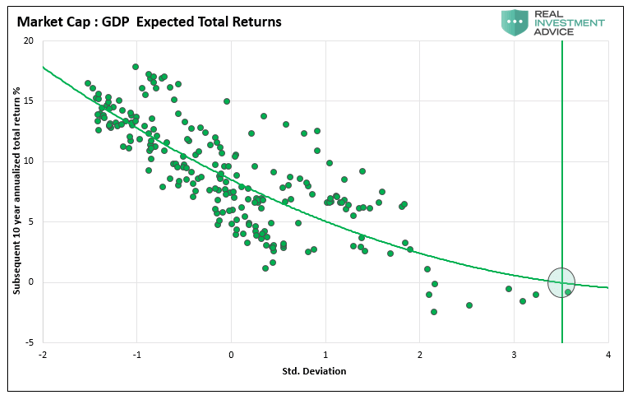
The following is the valuation measure that Warren Buffett tends to cite often. It is the market cap of global equities compared to GDP or the size of the economy. Today, that ratio is approximately 1.5x which is more than twice the historical average. If you follow the circle horizontally along the x-axis you can see it hits the y-axis right at zero implying 10-year annualized returns of nothing. No returns for ten years!
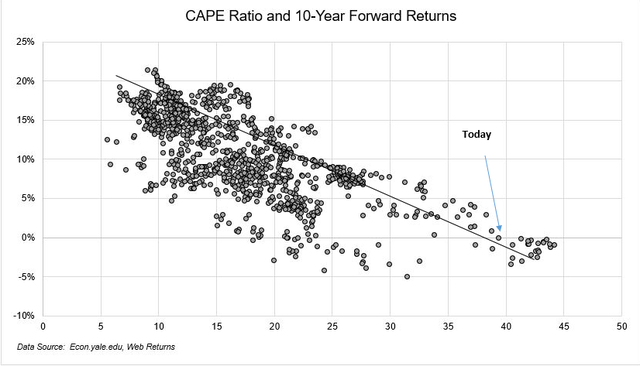
The CAPE Ratio is a popular one as it attempts to normalize P/E ratios over a business cycle. The correlation between buying at certain CAPE levels and subsequent 10-year returns is very high as evident that the dots are clumped together along a tight fit regression line. Obviously, low valuations tend to have higher subsequent returns and higher valuations lead to lower returns. Using today's metric of 37x, the 10-year return is likely to be closer to +1% per year.
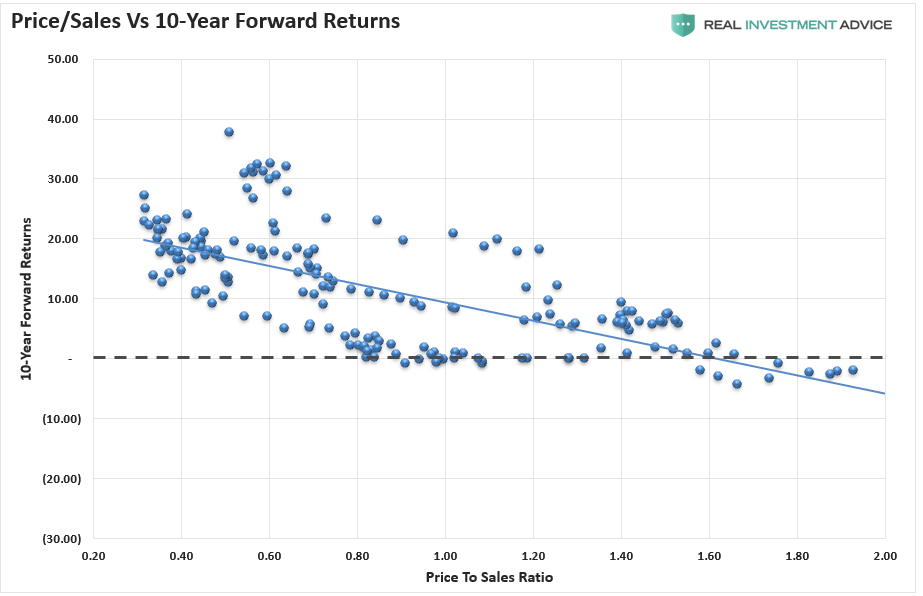
If we look at the price to sales ratio of the S&P 500, this valuation measure is one of the most bearish. It implies negative forward returns for the next ten years. The ratio currently sits over 2.5% which implies a negative return. To be fair, the sales levels are depressed as we reopen the economy. Still, even 33% higher implies very low single digit future returns.
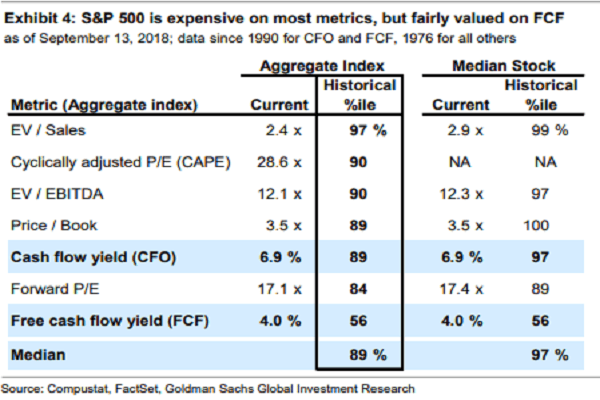
Here, Goldman Sachs compiles a list of popular valuation metrics and their historical percentile. For example, the EV/Sales ratio which looks at the total enterprise value to revenue of all the companies in the S&P 500 since 1976 sits at the 97th percentile. In other words, the current ratio of 2.4x is higher than all by 3% of observations going back 45 years. Most of the ratios are now very close to all time highs and sitting near the upper end of those ranges that include the 1999 tech bubble.
Will returns actually be this bad? Probably not. For the most part, what we typically see is a few good years followed by a very bad year and some sort of rebound. The actual numbers will depend highly on the start and end dates chosen for the analysis.
In any case, I do think anyone assuming their tech stock portfolio will return what it did from 2010 to 2020 is out to lunch. They will almost assuredly not. Still, one should expect maybe 5% to 6% returns from their broad equity exposure (maybe 6% to 7% for US only) with a lot of variability. Like we noted, some small up years following by a large down year.
Bonds Can Only Protect So Much So Their Role Is Changing
The benefit of holding bonds in a portfolio was two-fold. One, it gave you current income for your retirement spending (or reinvesting for compounding) and two, they provided downside protection as bonds tended to zig when stocks zagged.
Current income today is minimal with the yield on the Barclay's US Aggregate Bond Index down to 1.31%. Fifteen years ago that number was near 7% for an 81% drop in income production.
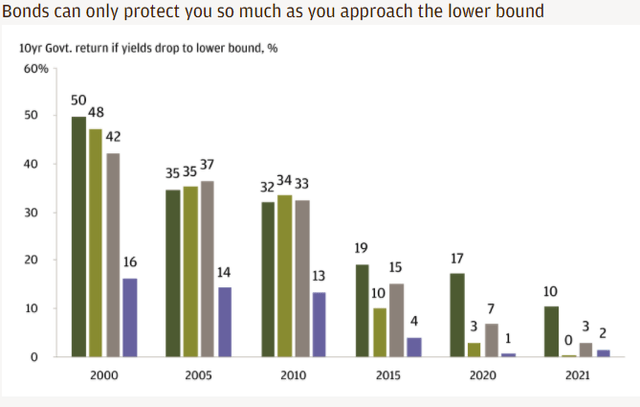
The downside protection is also minimal thanks to being so close to the zero-bound. Remember, bond prices and yields move in opposite directions. That means when the economy and stock market take a hit, interest rates fall, and bond prices rise. The increase in bond prices will push up your bond values offsetting some of the losses being experienced on the equity side. This is the downside buffer.
But with interest rates so low, the downside protection is nearly gone. In the US (dark green), the downside protection available today is a mere 10%. You can see that is down from 19% in 2015 and nearly 50% in 2000.
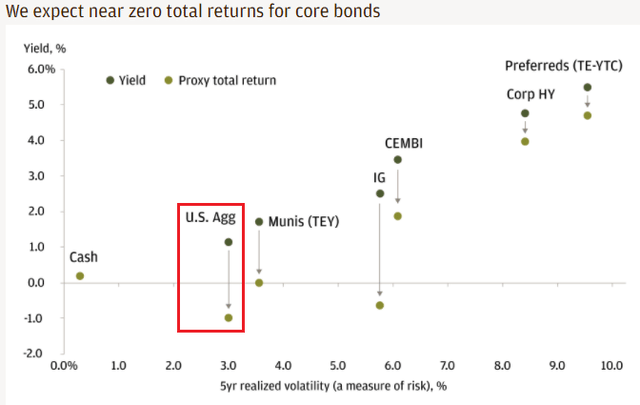
JP Morgan expects total returns for traditional bond portfolios to be close to zero. That is because the yield is so low that even a small uptick in interest rates will erase all the income gains and cause your yield to be wiped out by losses in values.
Even high yield is producing the lowest amount of income ever. In fact, a junk -rated company can now borrow at what the Federal Government was able to borrow at 3 years ago. Think about that!
Bonds today are not the same as they were. Interest rates being so low is now forcing investors to ask, why even bothering holding them? A lot of advisors and individual investors are instead shifting their asset allocation from 60-40 to something like 70-30 or 80-20. But as we noted above, valuations in the equity space are very rich.
Wrapping Up Part I
We discuss in the first part of this series how portfolio construction needs to look at a very different paradigm than it has over the last five decades. Equity markets have been on a tear and have pulled forward a lot of future earnings growth by companies.
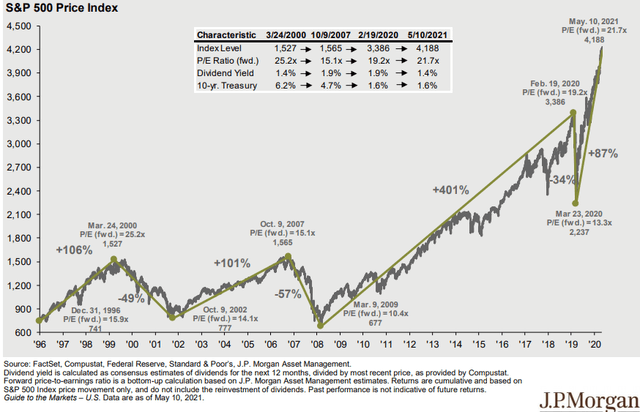
That doesn't mean we don't think you should be in stocks here. In fact, it's hard not to be. The 75% trailing one year return on the S&P 500 is the best since 1950. What happened in other periods of strong one-year growth? Historically, a pause.
If you look at all of the 50%+ rallies since 1950, the next twelve months have tended to be much less exciting. And 65% of the time the S&P 500 has been down for the next 12 months. The average market return has been about -1.5% over the next year. Then the market tends to turn higher as it digests the higher rates and higher valuations.
Higher rates in year two of a market cycle recovery have often led to a pause in the market advance only for markets to ultimately move higher. But investors who think that 8%+ returns and recent history is a predictor of the next ten years should study those charts above.
Even if there is no catalyst to send stocks lower, eventually valuations will be a headwind. When investors perceive valuations are too expensive, they tend to sell quickly at the sign of trouble- even nominal issues.
In Part II, we will look at how you can shift your portfolio construction to benefit in the new paradigm.
Time to go Yield Hunting!
Our member community is fairly uniquely focused primarily on constructing portfolios geared towards income. For those of you looking to revamp your fixed income allocation, create an income stream for paycheck replacement, or just diversify into some alternative securities, please give us a look!
The Core Income Portfolio currently yields over 8% comprised mainly of closed-end funds. We have three main portfolio’s as well as a peripheral investment database for those looking beyond what we recommend within the portfolios.
Core Income Portfolio This is our main model. It has about a dozen securities (almost all CEFs) with almost no equity exposure. The risk profile by NAV is less than half that of the S&P 500. It is a bit more passive than most portfolios, with only a handful of trades a month- making it very easy to follow even for the novice investor. Current yield 8.53%.
Flexible Income Portfolio: This is our active trading portfolio. It is designed for more aggressive investors looking to maximize capital gains along with yield- looking for funds that have a high probability of mean reversion (extremely large discounts that have a good chance of closing in the short term). Current yield of 7.46% (some tax-free muni income).
Taxable Income Portfolio: This portfolio takes a more tax-advantaged approach, attempting to maximize after tax gains by utilizing funds that keep an eye on tax liability. Current yield of 4.96% (mostly tax-free).
If you are interested in learning about closed-end funds and want guidance on generating income, check out our service today. We also have expert guidance on individual preferred stocks, BDCs, ETFs, and mutual funds.
In addition to the portfolios mentioned above, our subscription service provides:
Monthly Newsletters- Details the current investing environment, global news that can affect your portfolio, portfolio construction techniques and advice, and a review of the performance of our model portfolios.
Weekly Updates- Goes through the events of the week and things to watch for in the upcoming week. This also includes performance for our holdings, changes in the portfolio, new opportunities for investing, and the effects the current market situation will have on them.
Fund Analysis- Spotlight focus on investments we find particularly interesting with analysis from industry experts on opportunities we see in the CEF, REIT, Muni, and High Dividend Equity space.
Alerts - Buy/ sell alerts on securities within the portfolio as conditions warrant
24/7 Access- You’re not alone! You always have someone to answer your questions! We respond within 24 hours to any email from our members at admin@yieldhunting.com.
Retirement- Our ongoing series dedicated to helping retirees and those approaching retirement navigate the many issues they face.
... and much more!
We believe if you give our strategy a try, you will not be disappointed.
Try us for 7 days FREE!


