
CEF Report: Party Like It's February 2020


Summary
In this report, we discuss what's happening in the CEF world in terms of valuations which are nearing the tightest levels of the last five years.
Investors have a choice. They can be buy-and-hold investors and ride the wave, focusing on their income streams.
Or they can protect gains and rotate into open-end mutual funds slowly over time knowing they are cutting their income streams.
This is not an all or nothing type of decision. Investors should have an ultimate target for their CEF allocation and manage toward it.
I do much more than just articles at Yield Hunting: Alt Inc Opps: Members get access to model portfolios, regular updates, a chat room, and more. Get started today »
(This report was issued to members of Yield Hunting on Feb. 11.)
We expected January to be a good month for closed-end fund - and it was OK- but February is turning out to be one of the best months ever. Already, discounts have tightened by more than 1% on taxable bond CEFs and nearly that much on muni CEFs.
As of Feb. 8, taxable bond CEFs were trading at just -2.5% discounts compared to nearly -4% at the start of the year. At the same time, we have realized NAVs that have truly been on fire. This is not something we see all the time. Often, we have prices that lag fast-rising NAVs as investors fail to keep the buying up to track the NAV. Often, discount tightening is because prices are stable or rising and NAVs are falling. Not the ideal environment.
Today, we are seeing the best possible outcome for CEF investors. In this month's report we will discuss a lot of what we think investors should do and how to think about the CEF marketplace. Also, we will go through some of our top OEF mutual fund placeholders to rotate into as you trim or sell out of CEF positions.
Are CEFs Really Expensive?
Credit spreads and absolute yields are great barometers of the expensiveness of the taxable CEF space. Below is the BofA Merrill Lynch US High Yield Master Index OAS (option-adjusted spread) index. This basically shows the amount of additional yield the market is asking for above the same maturity treasury rate. In "good times" the market reduces the additional yield it requires to hold risky bonds. In "bad times" the spreads widen as investors require much higher yields to accept risk.
The effective yield for the below index hit an all-time low of 3.98% on Feb. 8. Just two years ago, the federal government was borrowing at 3.30%. That is the federal government who, in theory, has no risk of default! Today, investors are willing to buy "junk" debt for approximately the same yield.
Spreads today are near their pre-COVID levels at 3.5%. In March of last year spreads blew out to nearly 11% as investors sold off anything with even the slightest bit of risk to go to cash.
Credit spreads can be a great gauge of where we are in terms of valuations in the broader bond market. While looking at the broad asset categories (taxable bond, munis, equity) can be helpful from a broad sense, the best value comes from looking at sub-sector valuations.
In the last six months, most of the emphasis we have placed in our actively-managed Core Income Portfolio of CEFs was on the areas we thought were both A) cheap but also B) had strong future prospects. The latter is important because just because a sector is cheap doesn't mean it's a good value.
One area we did not like was taxable munis starting about four months ago. The sector itself was not cheap with all three funds trading at a premium. Guggenheim Taxable Muni (GBAB) was in our portfolio but reached a 12% premium. This despite the largest holding being a position in one of the other taxable muni CEFs. Clearly the managers were having trouble sourcing new Build-America Bonds as they haven't been issued in ten years. The yield on the fund was below 6%, taxable, with ~20% leverage. Not the greatest deal even though the credit risk was very low.
We rotated out of GBAB and BlackRock Taxable Muni (BBN) and into more risk assets in October and November to take advantage of the market dynamics. Our assessment was that once we passed the election (regardless of who won), the VIX would fall back and investors would re-enter the market driving it higher.
This turned out to be correct and November was one of the best months for CEFs ever.
Right now, overall discounts in the taxable side of the CEF market are heading down the mountain (right side of the distribution). Obviously, should it reach a premium to NAV, then we would be in that red zone territory with just 17% of total observations being richer. Or said another way, in the 83rd percentile for taxable bond CEF richness.

(Source: RiverNorth)
We think there's a bit more value on the muni side as the sector trades at a -3.7% discount and has a tighter long-term average discount. Muni CEFs are near long-term average values. However, NAVs are reaching high levels so I can foresee a slowdown in the NAV gains while prices continue higher reaching a premium to NAV. Approximately 17% of observations over the last 20 years has been above NAV in the muni space. I believe the environment is primed for that to occur again should the market environment remain relatively calm.
Using Yields and Z-Scores To Assess Valuations
I like using NAV yields and z-scores for sector valuation analysis and individual fund bets. In terms of yields, you cannot use distribution yields as the fund can set that at any rate they like. The move toward managed distribution policies ("MDPs") indicate that as funds like Nuveen Credit Strategies (JQC) and RiverNorth Opportunities (RIV) set very high distribution rates to attract investors to their funds.
One of the better indicators for us to use is leveraged adjusted NAV yields or LANY for short. This illustrates just how much a fund is stretching to reach a certain yield for the fund. As underlying portfolio yields come down, especially in the loan and high yield sectors, the fund will need to either venture down the risk spectrum in order to generate the same yield. If they don't, then the earnings power of the fund declines and the distribution gets shaky.
Z-scores are the more popular way to measure and assess both sector valuations and individual CEF valuations. At its most basic level, the z-score shows the standard deviation above or below the mean that a particular fund or discount trades. The go-to rule of thumb always has been a fund that is trading at -2 or lower is cheap and a fund trading at +2 or higher is rich. This is of course an overly simplistic way of looking for cheap funds. Typically, a cheap fund is cheap for a reason while expensive funds are also expensive for a reason.
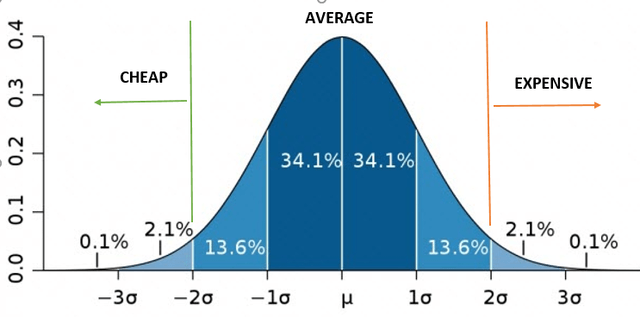
(Source: Google Image Search)
There are only two sectors that still boast a negative z-score and they are barely negative (equity tax advantaged and finance).
The most expensive sectors using one-year z-scores are:
Global Income +1.72
Limited Duration +1.48
Senior Loan +1.31
Convertibles +1.30
Municipal +1.24
Cheapest sectors:
Equity Tax-Advantaged -0.09
Finance -0.05
Growth & Income +0.10
MLP +0.15
Mortgages +0.22
But using 5-year Z-scores can be more significant and meaningful.
MLP -1.2
Covered call -0.95
Mortgage -0.42
Hybrid -0.38
Multisector -0.21
And most expensive:
Global income +2.82
Utilities +2.10
Taxable muni +2.10
Preferreds +1.25
Limited Duration +1.12
Obviously, within each sector there can be significant swapping opportunities. We will focus on that while at the same time looking at our exposure to the CEF space as a whole and looking to start reducing that exposure.
When Do You Take Profits And/Or De-Risk?
Each investor is different. I will write that again. Each investor is different. We have no idea as to your personal objectives and financial situations so we need to keep it broad. Most buy-and-holders will likely read this and say I'm not going to do anything. And there's absolutely nothing wrong with that.
Our service spans the gambit of very trader-oriented investors who like to capture pennies in volume to others who simply hold through the gyrations because their concern is the distribution. I know members who track their distributions on spreadsheets that do not even have the market values of the positions because they simply do not care. They look at the monthly and quarterly cash flow to see if it's increasing or not.
So when do you take profits?
I continue to look at my overall exposure to CEFs and adjust that accordingly. As I noted in the Whoopsies article, when valuations got rich in February 2020 I was too slow to react to it - even in the face of an unknown virus starting to make headlines.
Right now, my overall CEF exposure is running at 33.5%. That's down from nearly 40% almost a week ago. I've started to take it down. Now, some perspective is necessary. 40% for me is a significant overweight as my long-term average is about 25%- 27%. In November of last year I added and added more in December, especially in the muni and senior loan sectors.
So I'm still a bit overweight but watching positions closely. As positions reach our valuation targets on the Google Sheets, I begin to realize those gains and move into more open-end funds and even some cash/cash substitutes.
My goal is to get to that 25% average over the next few weeks, especially if prices continue to move as they have. Actually, if they continue at recent rates I could be there or below it next week!
So looking at relative levels matters. My goal as it stands would be to lower my CEF allocation to below 20% in the next couple of months. This is a game of chicken. There's a cost to trimming back in the CEF allocation as you will reduce your income stream and potentially total returns. But the cost of holding through a significant bout of volatility can be painful as well. The longer you hold, the more return you generate. But the longer you hold the longer you end up being the one holding the hot potato when the music stops. OK, enough metaphors.
The below chart shows the value of certain CEF sectors compared to open-end counterparts over five-year periods. But when you buy is imperative to producing those returns.
5-Year Total Returns:

(Source: BlackRock)
We think if you utilize the Google Sheets in conjunction with a target CEF allocation, you will "automatically" adjust your CEF allocation and reduce your total risk. As positions you hold trigger the sell flag on the sheet, you could start to monetize those positions with the goal of reaching a certain CEF total exposure percentage. For risk-averse individuals, that CEF exposure should be less than 20% and more likely around 10-15%. More aggressive investors could sustain CEF positions above 25%-30%.
In our Morning Notes, I'll continue to highlight buys (rare at the moment), sells, or swap opportunities. On the latter, remember the swapping into fund doesn't have to necessarily be cheap, just cheap relative to the fund we are swapping from.
But for the most part, I have been swapping from overvalued CEFs into open-end funds. My three go-to funds have been:
Guggenheim Total Return (GIBIX)(GIBLX) - lowest risk of the three
Yield 1.76%, duration 7.5 yrs, 80% IG (investment grade)
Columbia Mortgage Opps (CLMAX) - medium risk of the three
yield 3.16%, duration 0, 40% IG
Guggenheim Macro Opps (GIOAX) - highest risk of the three
yield 2.65%, duration 3.6 yrs, 36% IG
But even GIOAX is a relatively safe fund. It does have 25% in high-yield corporates and another 21% in bank loans.
And there I will be invested and wait for discounts to widen back out.
Concluding Thoughts
Over the next few weeks, we will be doing quick updates for the more popular bond sectors with updates on movements. We will highlight the sectors that are rich and the funds within that sector that are a clear sell along with possible swap candidates.
Discounts are tightening but they're not crazy tight as a broad sector (taxable bonds or muni bonds). Of course there are funds within each class that are very rich and some that are relatively undervalued.
Our Google Sheets have very few buys left on it. So buying new positions or even adding to existing positions will be rare. Instead, more tactical investors will want to start by assessing what is their target CEF allocation in "normal times" and what their allocation will be during "rich times" which we are quickly approaching. Then using the Google Sheets, start trimming back positions that have triggered the sell flag to reach those target allocations.